All templates

Deploy GlitchTip on your own server.

GlitchTip logo

GlitchTip is a simple, open-source error tracking application designed to collect, organize, and alert you about every error from your project in real time. It allows you to monitor your software's performance, track errors, and check your site's uptime all in one place. GlitchTip is compatible with Sentry client SDKs, offering a more…

Your infrastructureAutomatic HTTPSNo lock-in

Screenshots

A closer look at GlitchTip.
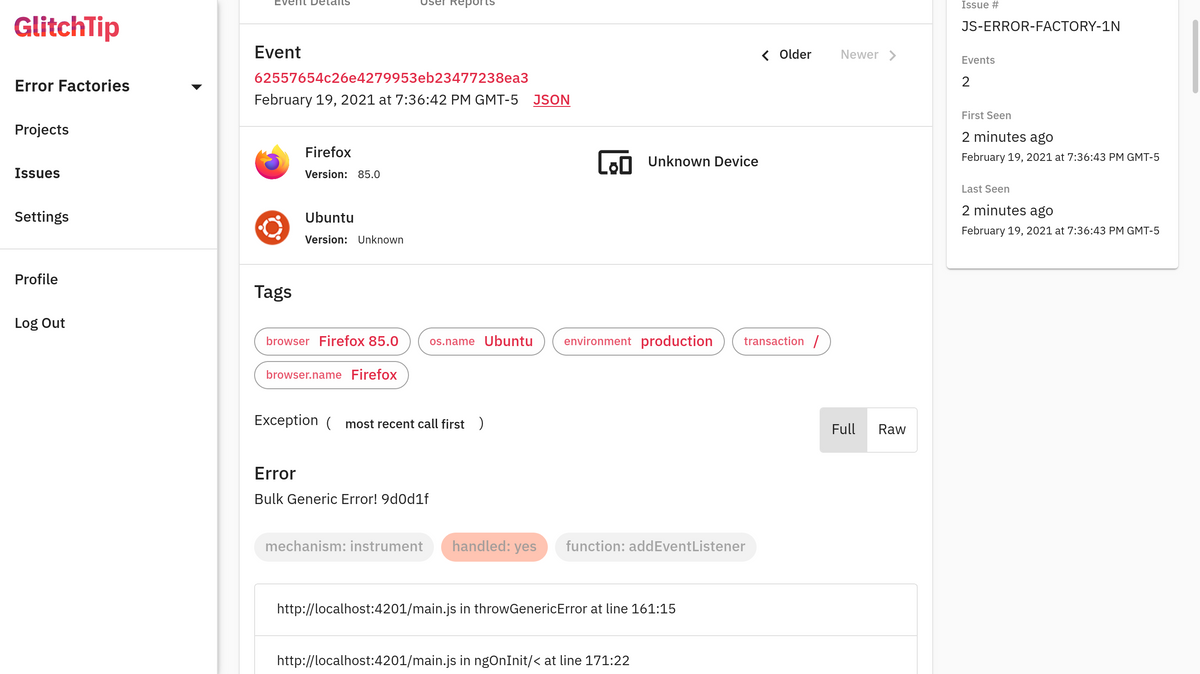
GlitchTip screenshot 1

Setup time

A few minutes

Deployment

Your own server

Services

4 connected services

Why GlitchTip

Everything you need, running where you choose.

Get the full GlitchTip experience with Easypanel handling the repetitive infrastructure work around it.

Error Tracking
GlitchTip allows you to report your website or application's exceptions, log messages, Content Security Policy violations, and more to one place for triage and resolution.
Application Performance Monitoring
GlitchTip provides a simple, out of the box approach to application performance monitoring. It helps you to identify your slowest web requests, database calls, and other transactions.
Uptime Monitoring
GlitchTip can ping your site and warn you when it's not responding. It can also reverse this process and send GlitchTip a request on schedule. If GlitchTip doesn't receive your ping, it will send you an alert.
Real-Time Error Tracking
GlitchTip collects every error from your project in real time, helping you to organize and make them useful. You can receive alerts when and where you want, ensuring you're always on top of any issues that arise.
Affordable and Simple
GlitchTip is designed with simplicity and affordability in mind. It's an open-source solution that you can modify and use as you see fit, without breaking your budget.
Performance Monitoring
With GlitchTip, you can monitor your application's performance and find out where your app is slow. It takes a simple, out of the box approach, helping you to identify your slowest web requests, database calls, and other transactions.
How it works

From template to live app in three steps.

Easypanel turns the template into real services, storage, and domains on the server you already control.

Already have Easypanel? Open your dashboard at the URL or IP of your own installation.

Installation guide
1
Open your dashboard
Visit the URL or IP of your Easypanel installation and choose the target project.
2
Choose GlitchTip
Open Templates, select GlitchTip, then review its service names and configuration.
3
Deploy and open your app
Easypanel starts every service and provisions an HTTPS domain for you.
Installation options
The template asks for these values before creating your services.
OptionDefaultRequired

Enable User Registration

falseOptional

Enable Organization Creation

falseOptional

App Service Name

glitchtipRequired

App Service Image

glitchtip/glitchtip:v6.0.3Required

Redis Service Name

glitchtip-dbRequired

Redis Service Name

glitchtip-redisRequired
Resources
Project documentation and source code.
Latest template update
Feb 21, 2026

Version bumped to v6.0.3

Questions

Deploy with confidence.

The template handles the application setup while Easypanel keeps the infrastructure understandable and under your control.

Keep exploring

Related templates

Browse all
Bugsink logo
Bugsink
Bugsink is a self-hosted error tracking system compatible with Sentry SDKs.
View template
Gatus logo
Gatus
Gatus is a self-hosted automated service health dashboard that monitors the uptime and performance of your services, APIs, and websites. The application provides a clean, modern web interface to visualize the health status of all your monitored endpoints in real-time. Gatus performs periodic health checks on configured endpoints, evaluating custom conditions like HTTP status codes, response body content, response times, and more. The dashboard displays detailed metrics including uptime percentages, average response times, and historical status data. With support for various alerting integrations including Discord, Slack, PagerDuty, and custom webhooks, Gatus can notify you immediately when services go down or fail health checks. The application supports complex condition evaluation using JSON path queries, pattern matching, and response time thresholds. Perfect for DevOps teams monitoring microservices infrastructure, system administrators tracking critical services, developers needing uptime monitoring for their applications, or anyone who wants a simple, self-hosted alternative to commercial monitoring services with complete control over their health checks and data.
View template
Dozzle logo
Dozzle
Dozzle is a lightweight, web-based Docker log viewer designed for real-time monitoring and easy troubleshooting. It allows you to view logs of other Docker containers in real-time, streaming new log entries to the web interface without the need for page refreshes. Despite its capabilities, Dozzle is a small application that consumes very little memory and CPU, ensuring it doesn't cause performance issues when run alongside other containers. It also supports connecting to multiple remote hosts, providing a simple drop-down menu to switch between different hosts. Dozzle doesn't store any log files and is solely for live monitoring of your container logs. It also features an intelligent fuzzy search for container names, regex log search, split screen for viewing multiple logs, and live stats with memory and CPU usage. It also provides authentication with a username and password for added security.
View template
GlitchTip logo
Ready to deploy GlitchTip?
Open your own Easypanel dashboard, choose GlitchTip from Templates, and review the deployment options.