Gatus
1-Click installation template for Gatus on Easypanel
Description
Gatus is a self-hosted automated service health dashboard that monitors the uptime and performance of your services, APIs, and websites. The application provides a clean, modern web interface to visualize the health status of all your monitored endpoints in real-time. Gatus performs periodic health checks on configured endpoints, evaluating custom conditions like HTTP status codes, response body content, response times, and more. The dashboard displays detailed metrics including uptime percentages, average response times, and historical status data. With support for various alerting integrations including Discord, Slack, PagerDuty, and custom webhooks, Gatus can notify you immediately when services go down or fail health checks. The application supports complex condition evaluation using JSON path queries, pattern matching, and response time thresholds. Perfect for DevOps teams monitoring microservices infrastructure, system administrators tracking critical services, developers needing uptime monitoring for their applications, or anyone who wants a simple, self-hosted alternative to commercial monitoring services with complete control over their health checks and data.
Instructions
you can modify the config from the config.yaml file in the storage section.
Benefits
- Automated Health Monitoring: Continuously monitor your services, APIs, and websites with automated health checks and real-time status updates.
- Custom Condition Evaluation: Define complex health check conditions using status codes, response body content, JSON path queries, and response time thresholds.
- Alerting Integrations: Get notified immediately when services fail through Discord, Slack, PagerDuty, email, or custom webhooks.
- Self-Hosted Control: Complete ownership of your monitoring data and health check configurations without relying on external services.
Features
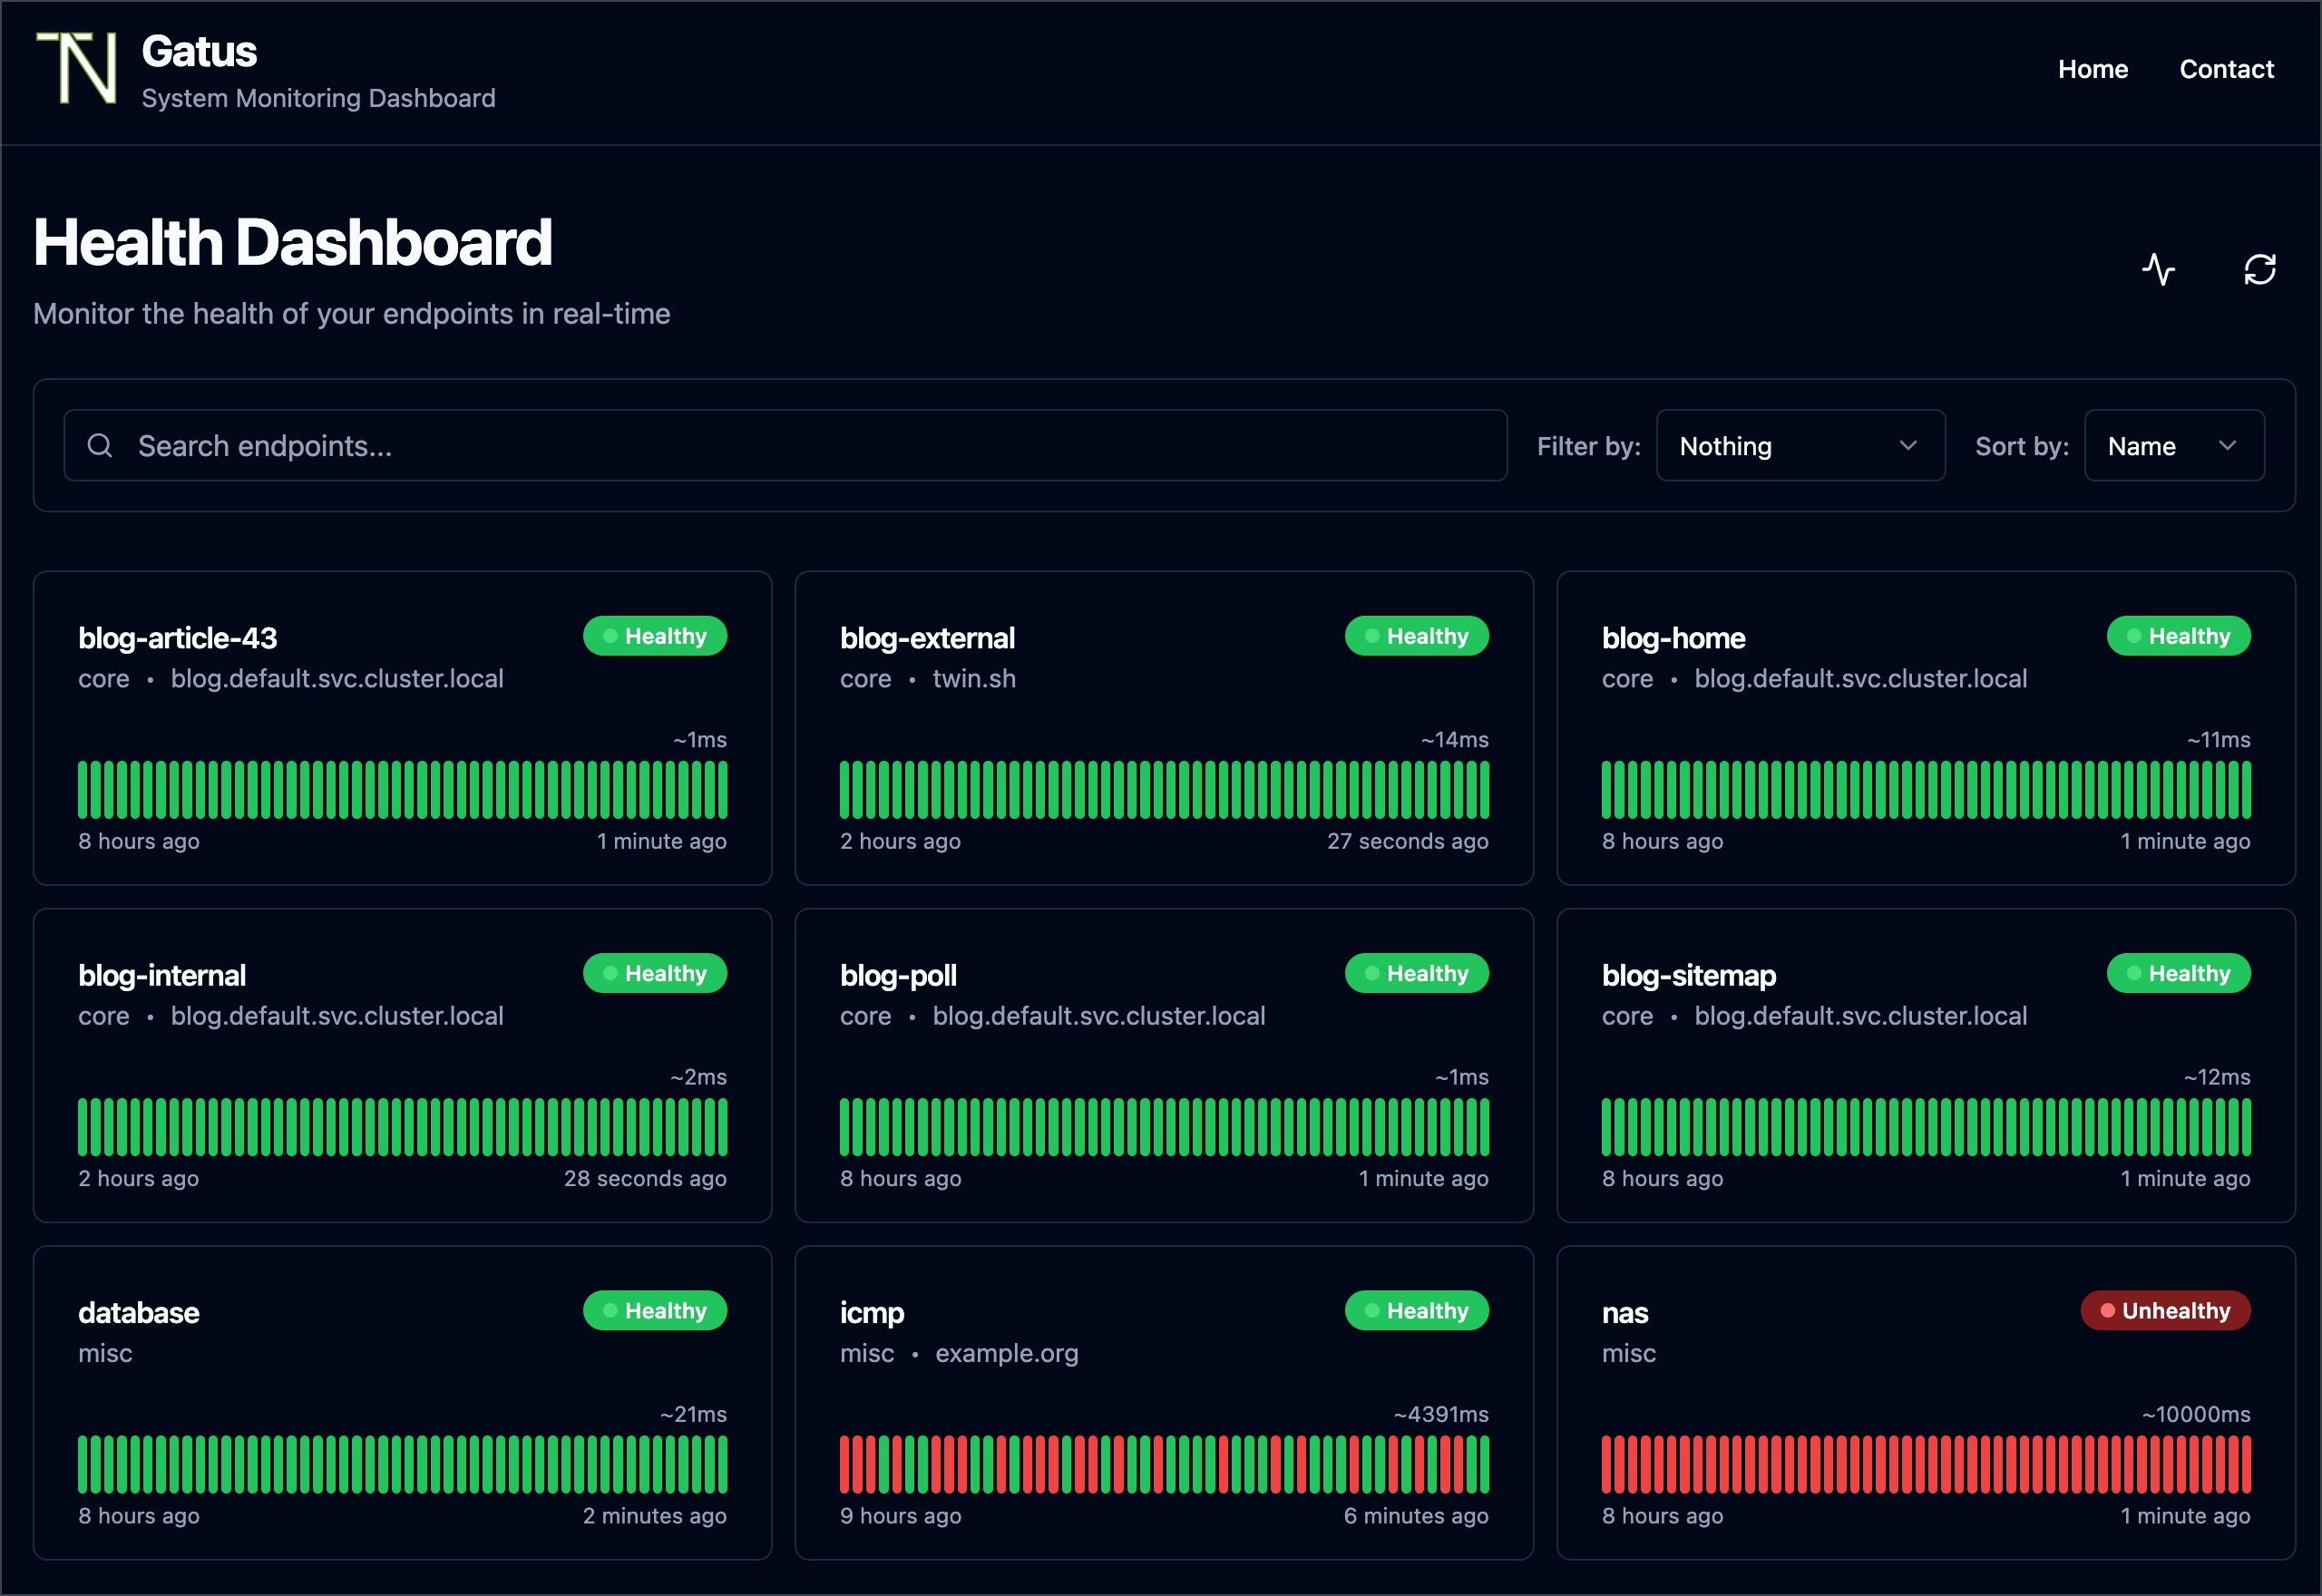
- Health Dashboard: Clean, modern web interface displaying real-time health status of all monitored endpoints with uptime percentages and metrics.
- Flexible Health Checks: Configure health checks with custom intervals, conditions, and evaluation criteria for each endpoint.
- Response Time Monitoring: Track and alert on response times to ensure services meet performance requirements.
- JSON Path Queries: Evaluate complex conditions using JSON path queries to check specific fields in API responses.
- Pattern Matching: Use pattern matching to verify response body content meets expected criteria.
- Historical Data: View historical status data and trends to identify patterns and recurring issues.
- Multiple Alert Channels: Configure alerts through Discord, Slack, PagerDuty, email, Teams, Mattermost, and custom webhooks.
- YAML Configuration: Simple YAML-based configuration for easy setup and management of monitoring endpoints.
Links
Options
| Name | Description | Required | Default Value |
|---|---|---|---|
| App Service Name | - | yes | gatus |
| App Service Image | - | yes | twinproduction/gatus:v5.33.1 |
Screenshots
Change Log
- 2025-12-17 – Template Release