All templates

Deploy Grafana OTEL LGTM on your own server.

Grafana OTEL LGTM logo

Grafana OTEL LGTM is an all-in-one OpenTelemetry backend bundled into a single Docker image. It includes the OpenTelemetry Collector, Prometheus for metrics, Grafana Loki for logs, Grafana Tempo for traces, Grafana Pyroscope for application profiles, and Grafana for unified visualization. The collector automatically routes telemetry…

Your infrastructureAutomatic HTTPSNo lock-in

Screenshots

A closer look at Grafana OTEL LGTM.
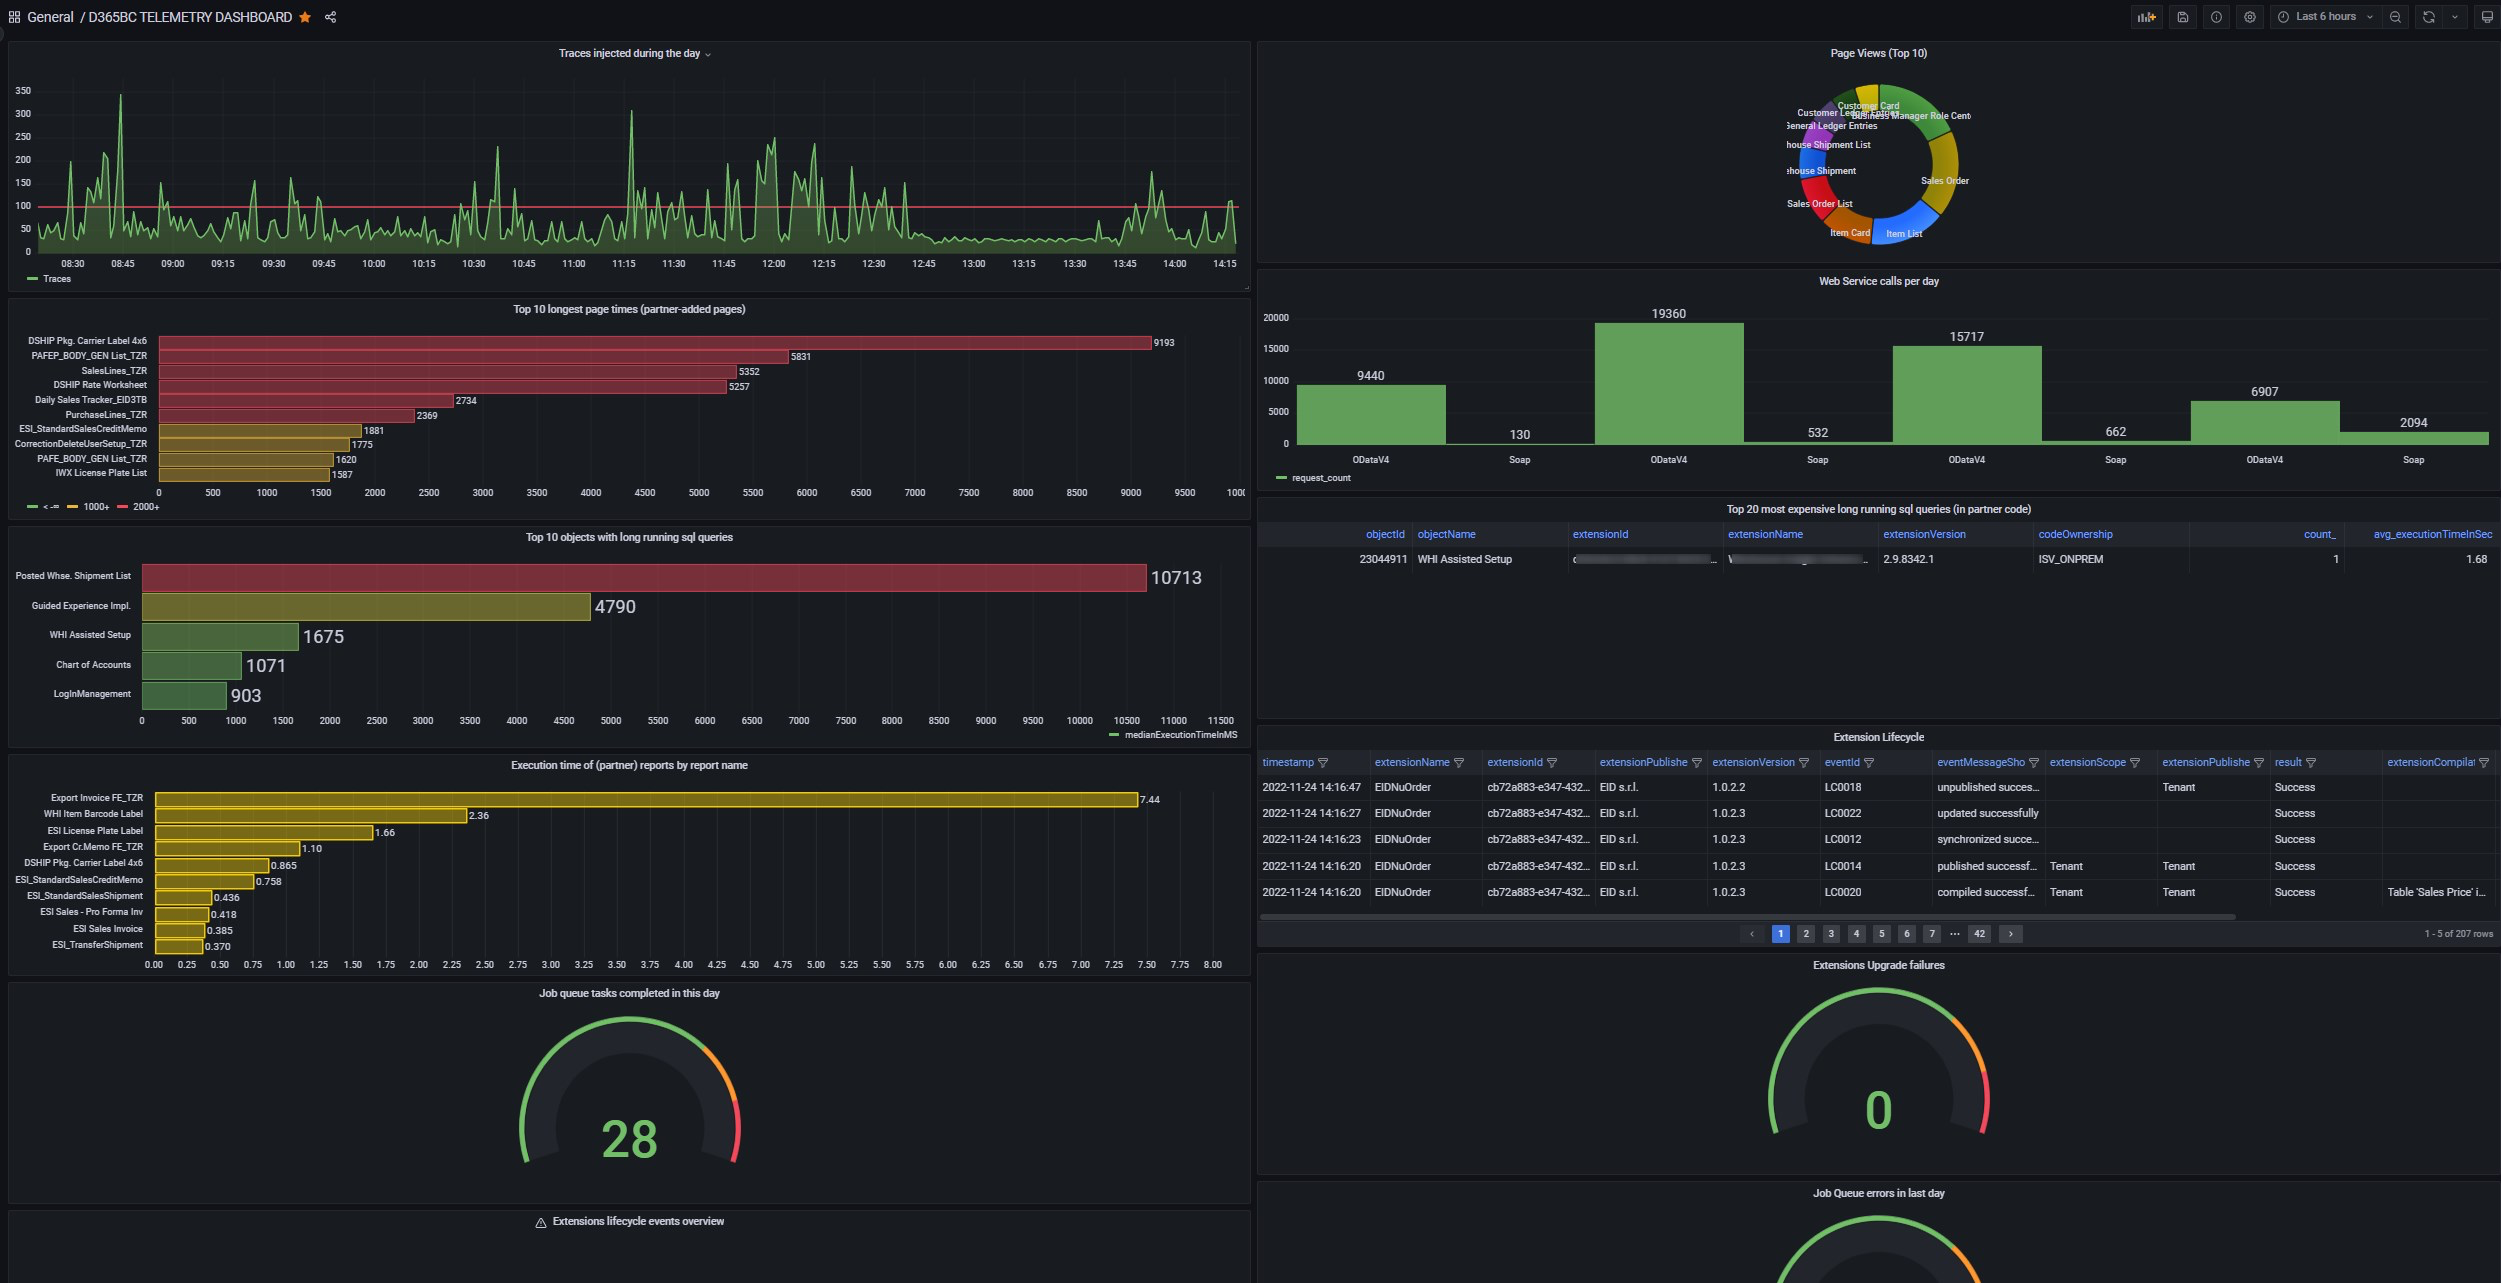
Grafana OTEL LGTM screenshot 1

Setup time

A few minutes

Deployment

Your own server

Services

1 connected service

Why Grafana OTEL LGTM

Everything you need, running where you choose.

Get the full Grafana OTEL LGTM experience with Easypanel handling the repetitive infrastructure work around it.

Automatic Signal Routing
The OpenTelemetry Collector automatically routes metrics to Prometheus, logs to Loki, traces to Tempo, and profiles to Pyroscope without manual pipeline configuration.
OTLP gRPC & HTTP Endpoints
Accepts telemetry data on port 4317 (gRPC) and port 4318 (HTTP) using the standard OpenTelemetry Protocol for maximum SDK compatibility.
Application Profiling
Grafana Pyroscope captures continuous application profiles for CPU, memory, and other runtime metrics to identify performance bottlenecks.
eBPF Auto-Instrumentation
Optional OBI support uses eBPF to automatically generate traces and RED metrics for HTTP/gRPC services with zero code changes (Linux kernel 5.8+ required).
Persistent Data Storage
All components write to a single /data directory. Mount a volume to persist metrics, logs, traces, and profiles across container restarts.
Configurable Logging
Enable debug logging for individual components (Grafana, Loki, Prometheus, Tempo, Pyroscope, OTel Collector) or all at once via environment variables.
How it works

From template to live app in three steps.

Easypanel turns the template into real services, storage, and domains on the server you already control.

Already have Easypanel? Open your dashboard at the URL or IP of your own installation.

Installation guide
1
Open your dashboard
Visit the URL or IP of your Easypanel installation and choose the target project.
2
Choose Grafana OTEL LGTM
Open Templates, select Grafana OTEL LGTM, then review its service names and configuration.
3
Deploy and open your app
Easypanel starts every service and provisions an HTTPS domain for you.
Installation options
The template asks for these values before creating your services.
OptionDefaultRequired

App Service Name

grafana-otel-lgtmRequired

Grafana OTEL LGTM Image

grafana/otel-lgtm:0.27.0Required

OTLP Port

4317Optional

OTLP HTTP Port

4318Optional
Resources
Project documentation and source code.
Latest template update
Apr 29, 2026

Version bumped to 0.27.0

Questions

Deploy with confidence.

The template handles the application setup while Easypanel keeps the infrastructure understandable and under your control.

Keep exploring

Related templates

Browse all
HyperDX logo
HyperDX
HyperDX is an open-source observability platform that unifies logs, metrics, traces, and session replays in one place. Built on ClickHouse for blazing-fast performance, it allows you to search terabytes of events in seconds without complex syntax. Perfect for debugging production issues, monitoring application performance, and correlating user sessions with backend traces. Recently acquired by ClickHouse to accelerate the future of open-source observability.
View template
Uptrace logo
Uptrace
Uptrace is an open-source APM platform for traces, metrics, and logs using OpenTelemetry, with ClickHouse storage and PostgreSQL metadata. This template follows the official example/docker compose stack (Uptrace, ClickHouse, Postgres, Redis, OTel Collector, Vector, Grafana, Prometheus, Alertmanager, Mailpit). The Vector image uses timberio/vector:0.28.X-alpine to match that upstream example (legacy Docker Hub namespace); migrate to distroless/vector only when you intentionally diverge from upstream.
View template
Grafana logo
Grafana
Grafana is a powerful, open-source platform designed to provide comprehensive metrics, logs, and trace data visualization. It allows users to query, visualize, and alert on their data, offering high-scale distributed tracing and scalable, performant metrics. The app also includes features for incident response and management, performance testing, and on-call management. Grafana can connect to various data sources and applications, providing operational dashboards for your data anywhere. It also offers a free forever plan, allowing users to monitor their data with 10,000 series metrics, 50 GB of logs, 50 GB of traces, and 500 VUh of k6 testing. Grafana is a versatile tool for anyone looking to gain insights from their data.
View template
Grafana OTEL LGTM logo
Ready to deploy Grafana OTEL LGTM?
Open your own Easypanel dashboard, choose Grafana OTEL LGTM from Templates, and review the deployment options.