All templates

Deploy Grafana on your own server.

Grafana logo

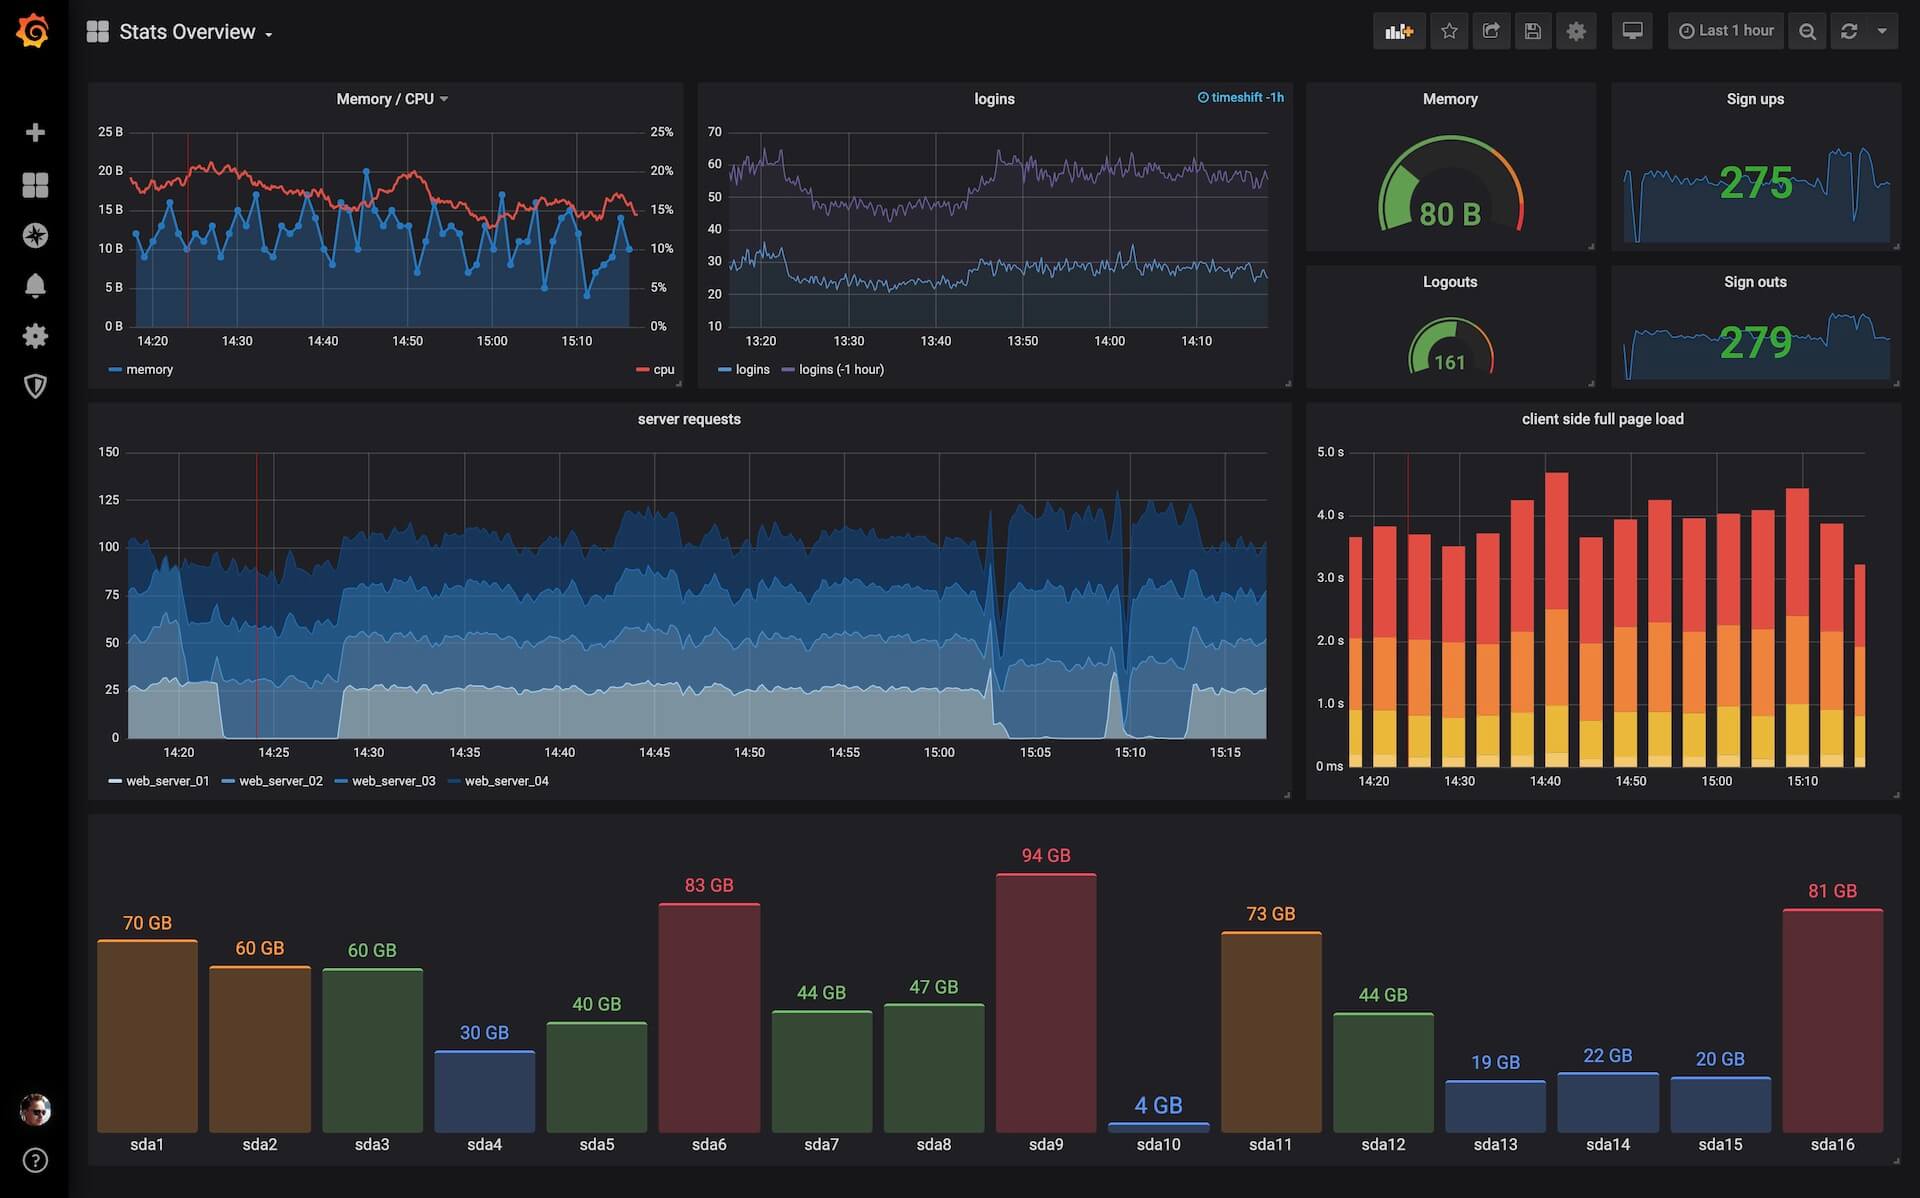
Grafana is a powerful, open-source platform designed to provide comprehensive metrics, logs, and trace data visualization. It allows users to query, visualize, and alert on their data, offering high-scale distributed tracing and scalable, performant metrics. The app also includes features for incident response and management, performance…

Your infrastructureAutomatic HTTPSNo lock-in

Screenshots

A closer look at Grafana.

Grafana screenshot 1

Setup time

A few minutes

Deployment

Your own server

Services

1 connected service

Why Grafana

Everything you need, running where you choose.

Get the full Grafana experience with Easypanel handling the repetitive infrastructure work around it.

Grafana Loki
A multi-tenant log aggregation system that allows you to easily manage and analyze your logs.
Grafana Tempo
A high-scale distributed tracing backend that provides detailed insights into your systems.
Grafana Mimir
A scalable and performant metrics backend that allows you to effectively monitor your systems.
Grafana OnCall
An on-call management feature that ensures you can quickly respond to incidents and issues.
Grafana k6
A load testing tool for engineering teams that helps ensure your systems can handle the demands placed on them.
Prometheus
A powerful tool for monitoring Kubernetes and cloud native systems, providing detailed insights and metrics.
How it works

From template to live app in three steps.

Easypanel turns the template into real services, storage, and domains on the server you already control.

Already have Easypanel? Open your dashboard at the URL or IP of your own installation.

Installation guide
1
Open your dashboard
Visit the URL or IP of your Easypanel installation and choose the target project.
2
Choose Grafana
Open Templates, select Grafana, then review its service names and configuration.
3
Deploy and open your app
Easypanel starts every service and provisions an HTTPS domain for you.
Installation options
The template asks for these values before creating your services.
OptionDefaultRequired

App Service Name

grafanaRequired

App Service Image

grafana/grafana-oss:13.0.1Required
Resources
Project documentation and source code.
Latest template update
Apr 29, 2026

Version bumped to 13.0.1

Questions

Deploy with confidence.

The template handles the application setup while Easypanel keeps the infrastructure understandable and under your control.

Keep exploring

Related templates

Browse all
GHStats logo
GHStats
GHStats is a self-hosted GitHub statistics and analytics tool that helps you track and visualize your GitHub repository metrics. Monitor stars, traffic, clones, views, and other important repository statistics over time with an intuitive web interface. The application collects and stores historical data from your GitHub repositories, allowing you to analyze trends and growth patterns that would otherwise be lost after GitHub's 14-day statistics retention period. Perfect for developers, project maintainers, and organizations who want to maintain long-term analytics of their GitHub presence. GHStats requires a GitHub personal access token to fetch repository statistics and stores all collected data persistently for historical analysis and visualization.
View template
Jaeger logo
Jaeger
Jaeger is an end-to-end distributed tracing system used for monitoring and troubleshooting microservices-based architectures. It helps developers track requests across complex systems, visualize latencies, and diagnose performance issues. Jaeger supports multiple storage backends and provides powerful querying and visualization capabilities. It is designed to be scalable and production-ready, making it a valuable tool for debugging and optimizing distributed applications.
View template
Grafana OTEL LGTM logo
Grafana OTEL LGTM
Grafana OTEL LGTM is an all-in-one OpenTelemetry backend bundled into a single Docker image. It includes the OpenTelemetry Collector, Prometheus for metrics, Grafana Loki for logs, Grafana Tempo for traces, Grafana Pyroscope for application profiles, and Grafana for unified visualization. The collector automatically routes telemetry signals to the correct backend — metrics to Prometheus, logs to Loki, traces to Tempo, and profiles to Pyroscope. It works out of the box with OpenTelemetry's default settings, so applications instrumented with any OpenTelemetry SDK can send data immediately. Optional eBPF auto-instrumentation (OBI) can generate traces and RED metrics for HTTP/gRPC services with zero code changes.
View template
Grafana logo
Ready to deploy Grafana?
Open your own Easypanel dashboard, choose Grafana from Templates, and review the deployment options.