All templates

Deploy Homepage on your own server.

Homepage logo

Homepage is a self-hosted dashboard designed to provide a centralized hub for accessing and managing your server and web services. With an intuitive and customizable interface, Homepage makes it easy to organize links, monitor system health, and view important metrics in one place. It supports a wide range of integrations, including…

Your infrastructureAutomatic HTTPSNo lock-in

Screenshots

A closer look at Homepage.
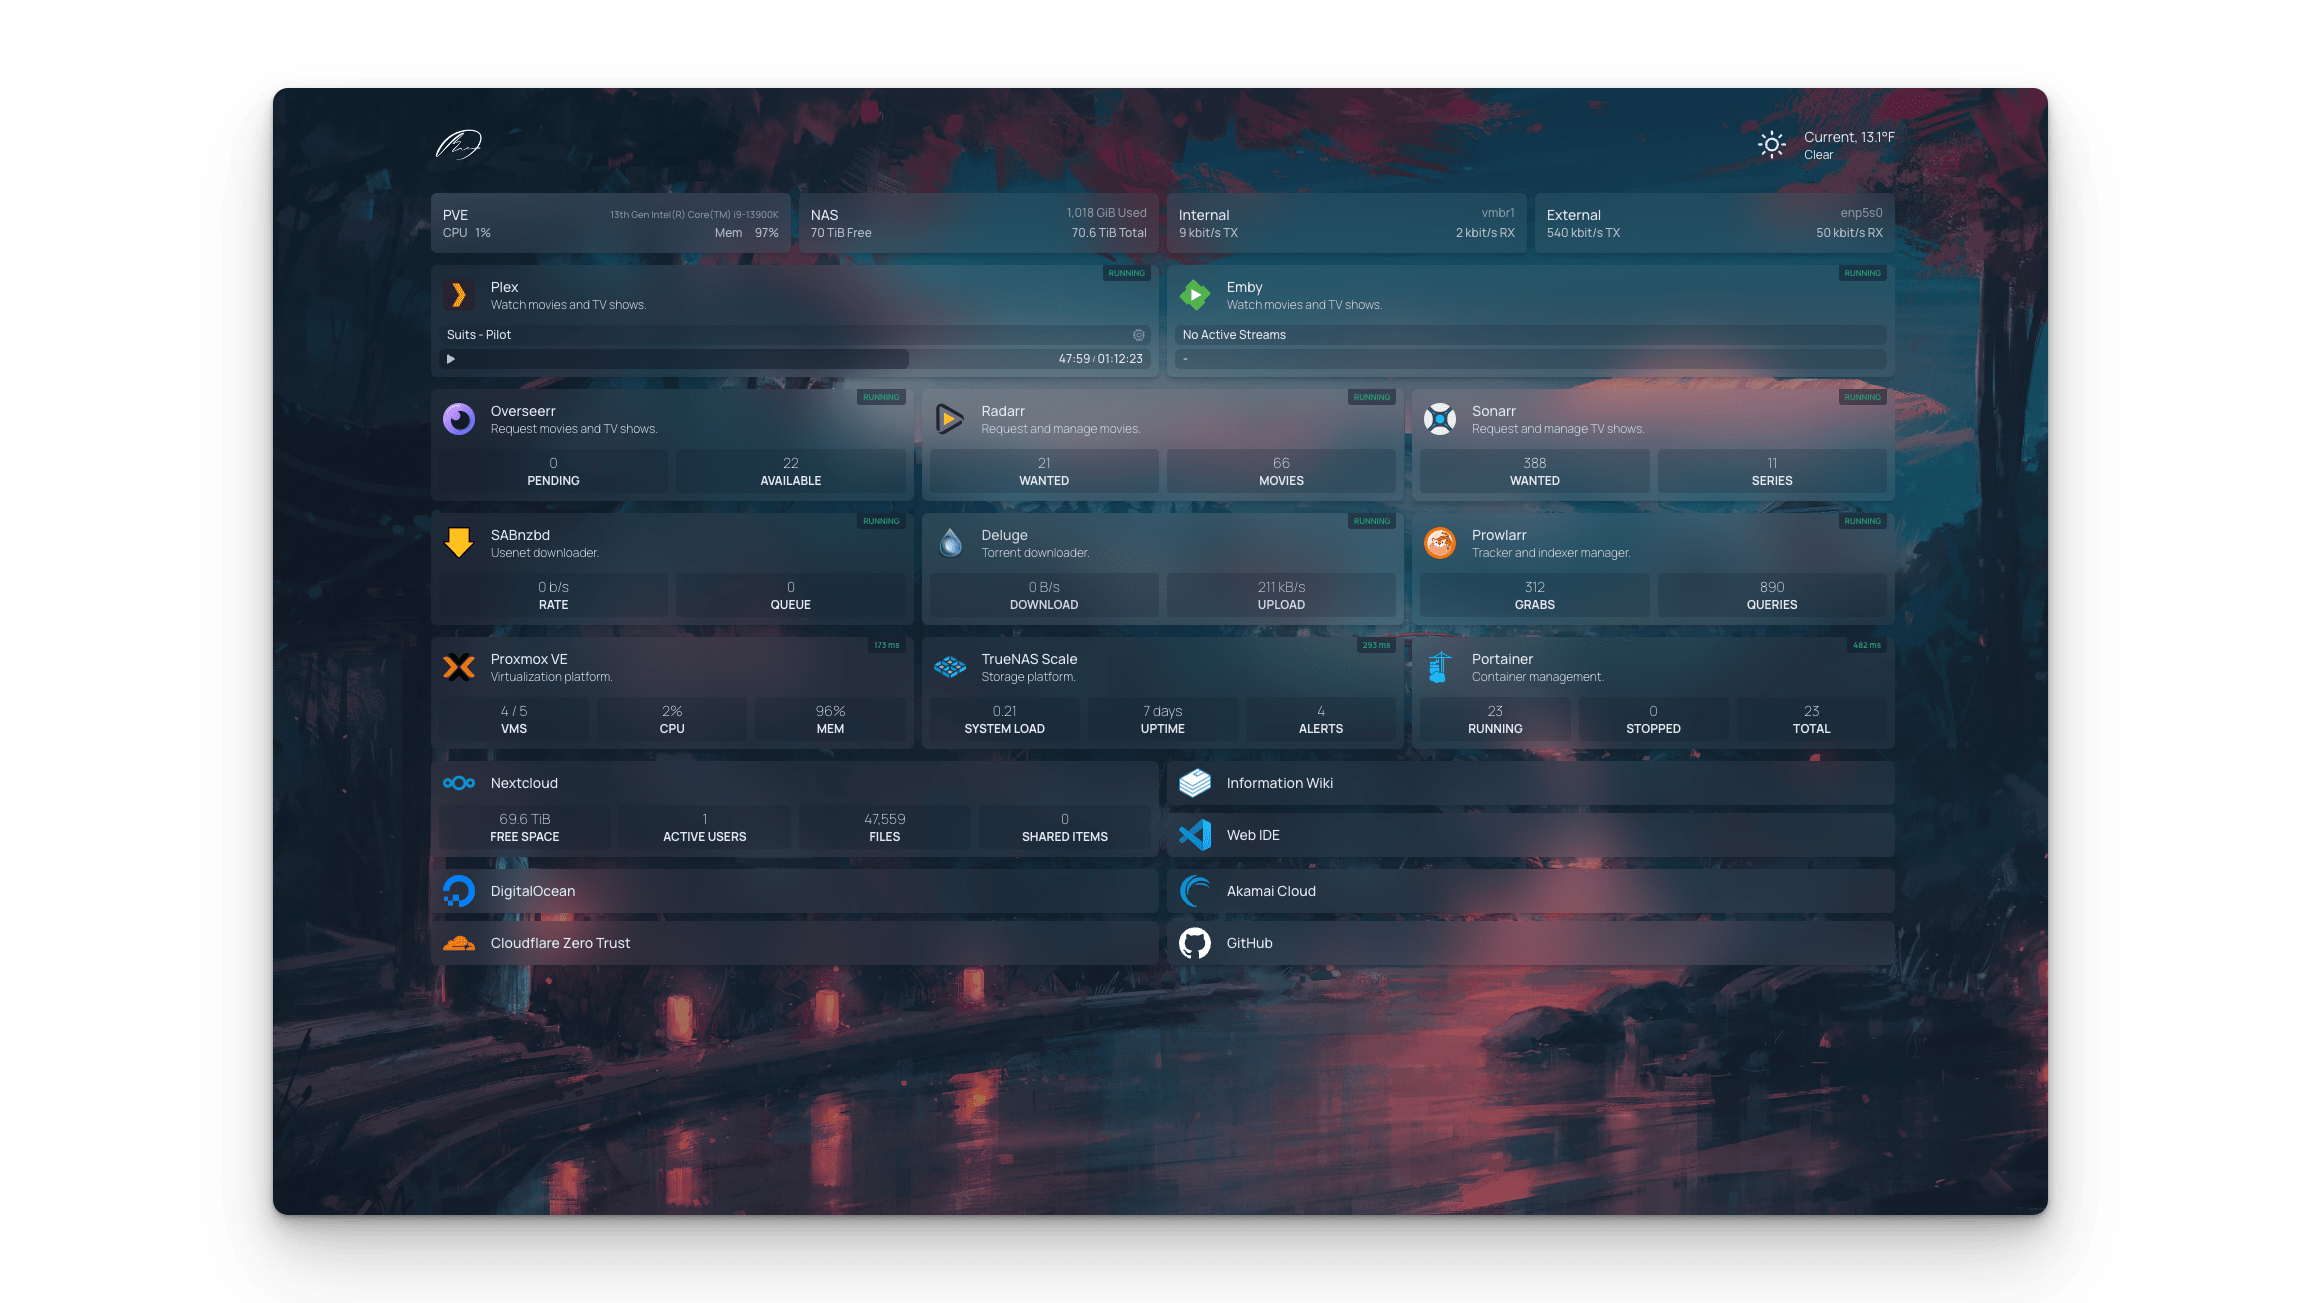
Homepage screenshot 1

Setup time

A few minutes

Deployment

Your own server

Services

1 connected service

Why Homepage

Everything you need, running where you choose.

Get the full Homepage experience with Easypanel handling the repetitive infrastructure work around it.

Link Management
Organize and display quick access links to frequently used services and applications.
System Metrics
View critical system information such as CPU, memory usage, and disk status directly on your dashboard.
User-Friendly Interface
Enjoy an intuitive and visually appealing interface for managing services and links.
API and Remote Configuration
Configure and manage Homepage remotely via its robust API support.
Lightweight and Easy to Deploy
Deploy Homepage effortlessly with minimal resources, ensuring a smooth setup experience.
Centralized Dashboard
Homepage provides a centralized location to access links, services, and metrics, improving efficiency and organization.
How it works

From template to live app in three steps.

Easypanel turns the template into real services, storage, and domains on the server you already control.

Already have Easypanel? Open your dashboard at the URL or IP of your own installation.

Installation guide
1
Open your dashboard
Visit the URL or IP of your Easypanel installation and choose the target project.
2
Choose Homepage
Open Templates, select Homepage, then review its service names and configuration.
3
Deploy and open your app
Easypanel starts every service and provisions an HTTPS domain for you.
Installation options
The template asks for these values before creating your services.
OptionDefaultRequired

App Service Name

homepageRequired

App Service Image

ghcr.io/gethomepage/homepage:v1.12.3Required
Resources
Project documentation and source code.
Latest template update
May 8, 2026

Version bumped to v1.12.3

Questions

Deploy with confidence.

The template handles the application setup while Easypanel keeps the infrastructure understandable and under your control.

Keep exploring

Related templates

Browse all
Homarr logo
Homarr
Homarr is a powerful dashboard designed to simplify the management of your server. It provides a sleek, modern interface that brings all your apps and services together in one place, allowing you to access and control everything with ease. Homarr seamlessly integrates with the apps you've added, offering valuable insights and complete control. You can add your self-hosted applications or favorite websites to your dashboard and organize them as you like. Homarr supports integration with many popular applications to enhance your user experience. It is customizable, accessible, and supports 23 languages. With Homarr, you can control and monitor your network directly, use integrations to display data and control apps, and even create your own dashboard using a comprehensible and easy-to-use visual editor. Homarr is open-source and allows commercial usage. It features a quick search function to easily navigate through your apps and supported integrations.
View template
Glance logo
Glance
Glance is a fast and lightweight self-hosted dashboard that allows you to monitor various real-time data sources through customizable widgets. With support for RSS feeds, market prices, YouTube uploads, Twitch streams, weather forecasts, server stats, Docker container status, and more, Glance provides a centralized hub for tracking essential information. The dashboard is fully themeable, optimized for mobile devices, and highly configurable through YAML-based settings.
View template
Gatus logo
Gatus
Gatus is a self-hosted automated service health dashboard that monitors the uptime and performance of your services, APIs, and websites. The application provides a clean, modern web interface to visualize the health status of all your monitored endpoints in real-time. Gatus performs periodic health checks on configured endpoints, evaluating custom conditions like HTTP status codes, response body content, response times, and more. The dashboard displays detailed metrics including uptime percentages, average response times, and historical status data. With support for various alerting integrations including Discord, Slack, PagerDuty, and custom webhooks, Gatus can notify you immediately when services go down or fail health checks. The application supports complex condition evaluation using JSON path queries, pattern matching, and response time thresholds. Perfect for DevOps teams monitoring microservices infrastructure, system administrators tracking critical services, developers needing uptime monitoring for their applications, or anyone who wants a simple, self-hosted alternative to commercial monitoring services with complete control over their health checks and data.
View template
Homepage logo
Ready to deploy Homepage?
Open your own Easypanel dashboard, choose Homepage from Templates, and review the deployment options.