All templates

Deploy Prometheus on your own server.

Prometheus logo

Prometheus is an open-source monitoring and alerting toolkit designed for reliability and scalability. It collects metrics from configured targets at specified intervals, evaluates rule expressions, and triggers alerts when specified conditions are observed. Prometheus stores all data as time-series, making it ideal for monitoring…

Your infrastructureAutomatic HTTPSNo lock-in

Screenshots

A closer look at Prometheus.
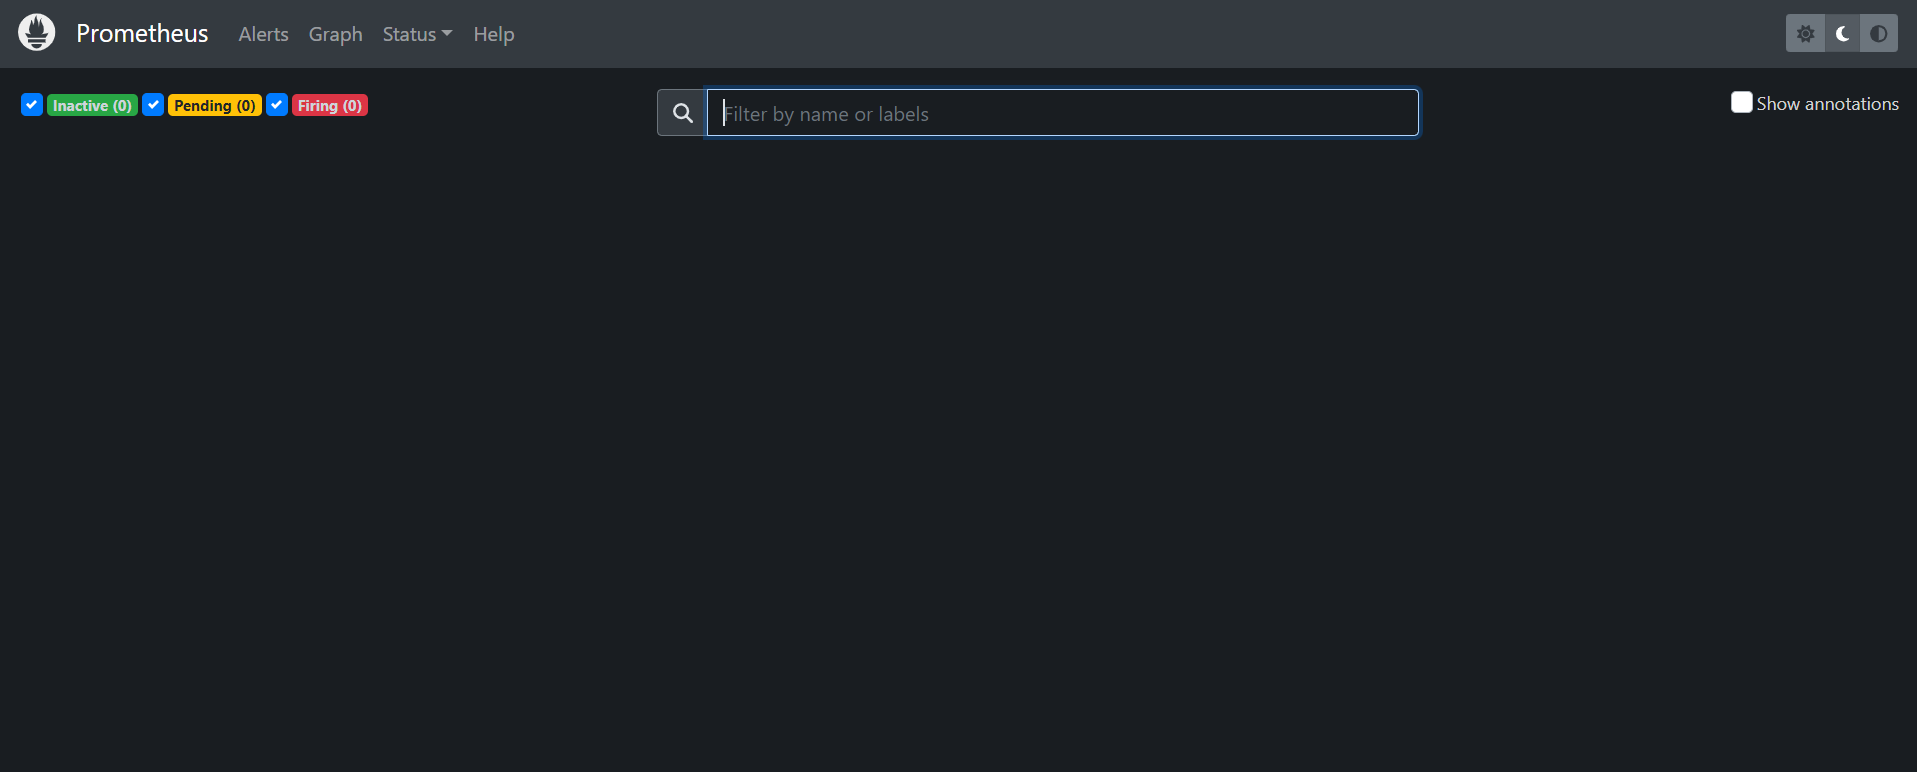
Prometheus screenshot 1

Setup time

A few minutes

Deployment

Your own server

Services

1 connected service

Why Prometheus

Everything you need, running where you choose.

Get the full Prometheus experience with Easypanel handling the repetitive infrastructure work around it.

Metric Collection
Prometheus scrapes metrics from a wide range of targets, storing them as time-series data for analysis and alerting.
Custom Dashboards
Use Prometheus with tools like Grafana to create detailed custom dashboards for visualizing metrics and performance data.
Alerting
Set up alerts using Alertmanager to get notified via various channels like email, Slack, or PagerDuty when specific conditions are met.
PromQL Query Language
Leverage PromQL, a powerful query language, to extract and analyze time-series data in real time.
Container and Cloud Integration
Prometheus integrates seamlessly with Docker, Kubernetes, and other cloud-native platforms to monitor microservices, containers, and distributed systems.
Exporters
Utilize Prometheus exporters to collect metrics from various applications, databases, and system components, expanding Prometheus' monitoring capabilities.
How it works

From template to live app in three steps.

Easypanel turns the template into real services, storage, and domains on the server you already control.

Already have Easypanel? Open your dashboard at the URL or IP of your own installation.

Installation guide
1
Open your dashboard
Visit the URL or IP of your Easypanel installation and choose the target project.
2
Choose Prometheus
Open Templates, select Prometheus, then review its service names and configuration.
3
Deploy and open your app
Easypanel starts every service and provisions an HTTPS domain for you.
Installation options
The template asks for these values before creating your services.
OptionDefaultRequired

App Service Name

prometheusRequired

App Service Image

prom/prometheus:v3.8.1Required
Resources
Project documentation and source code.
Latest template update
Dec 29, 2025

Version bumped to v3.8.1

Questions

Deploy with confidence.

The template handles the application setup while Easypanel keeps the infrastructure understandable and under your control.

Keep exploring

Related templates

Browse all
InfluxDB logo
InfluxDB
InfluxDB is a time-series database designed to handle high write and query loads commonly required for real-time analytics. It’s optimized for storing timestamped data, making it ideal for monitoring metrics, tracking events, and handling sensor data. With its efficient storage engine, InfluxDB offers built-in support for data compression and compaction, allowing for efficient data retention and storage. This database supports SQL-like queries through InfluxQL, integrates seamlessly with popular data visualization tools like Grafana, and can handle data from IoT devices, DevOps monitoring, finance, and more.
View template
Dockge logo
Dockge
Dockge is a modern, self-hosted Docker Compose management tool that provides a beautiful and intuitive web interface for managing your Docker Compose stacks. It allows you to create, edit, start, stop, and monitor your Docker Compose applications through a user-friendly dashboard. Dockge simplifies Docker Compose management with features like real-time logs, stack monitoring, and easy configuration editing.
View template
Dockhand logo
Dockhand
Dockhand is a modern Docker container management and monitoring tool that provides an intuitive web interface for managing your Docker containers, images, volumes, and networks. With real-time container statistics, log viewing, and container lifecycle management, Dockhand simplifies Docker operations for both developers and system administrators. The application offers comprehensive container management capabilities including start, stop, restart, and removal operations, along with detailed container information and resource usage monitoring. Perfect for developers who need a visual interface for Docker management, system administrators monitoring container infrastructure, or teams looking for an alternative to command-line Docker tools.
View template
Prometheus logo
Ready to deploy Prometheus?
Open your own Easypanel dashboard, choose Prometheus from Templates, and review the deployment options.