Deploy Grafana on your own server.
Grafana is a powerful, open-source platform designed to provide comprehensive metrics, logs, and trace data visualization. It allows users to query, visualize, and alert on their data, offering high-scale distributed tracing and scalable, performant metrics. The app also includes features for incident response and management, performance…
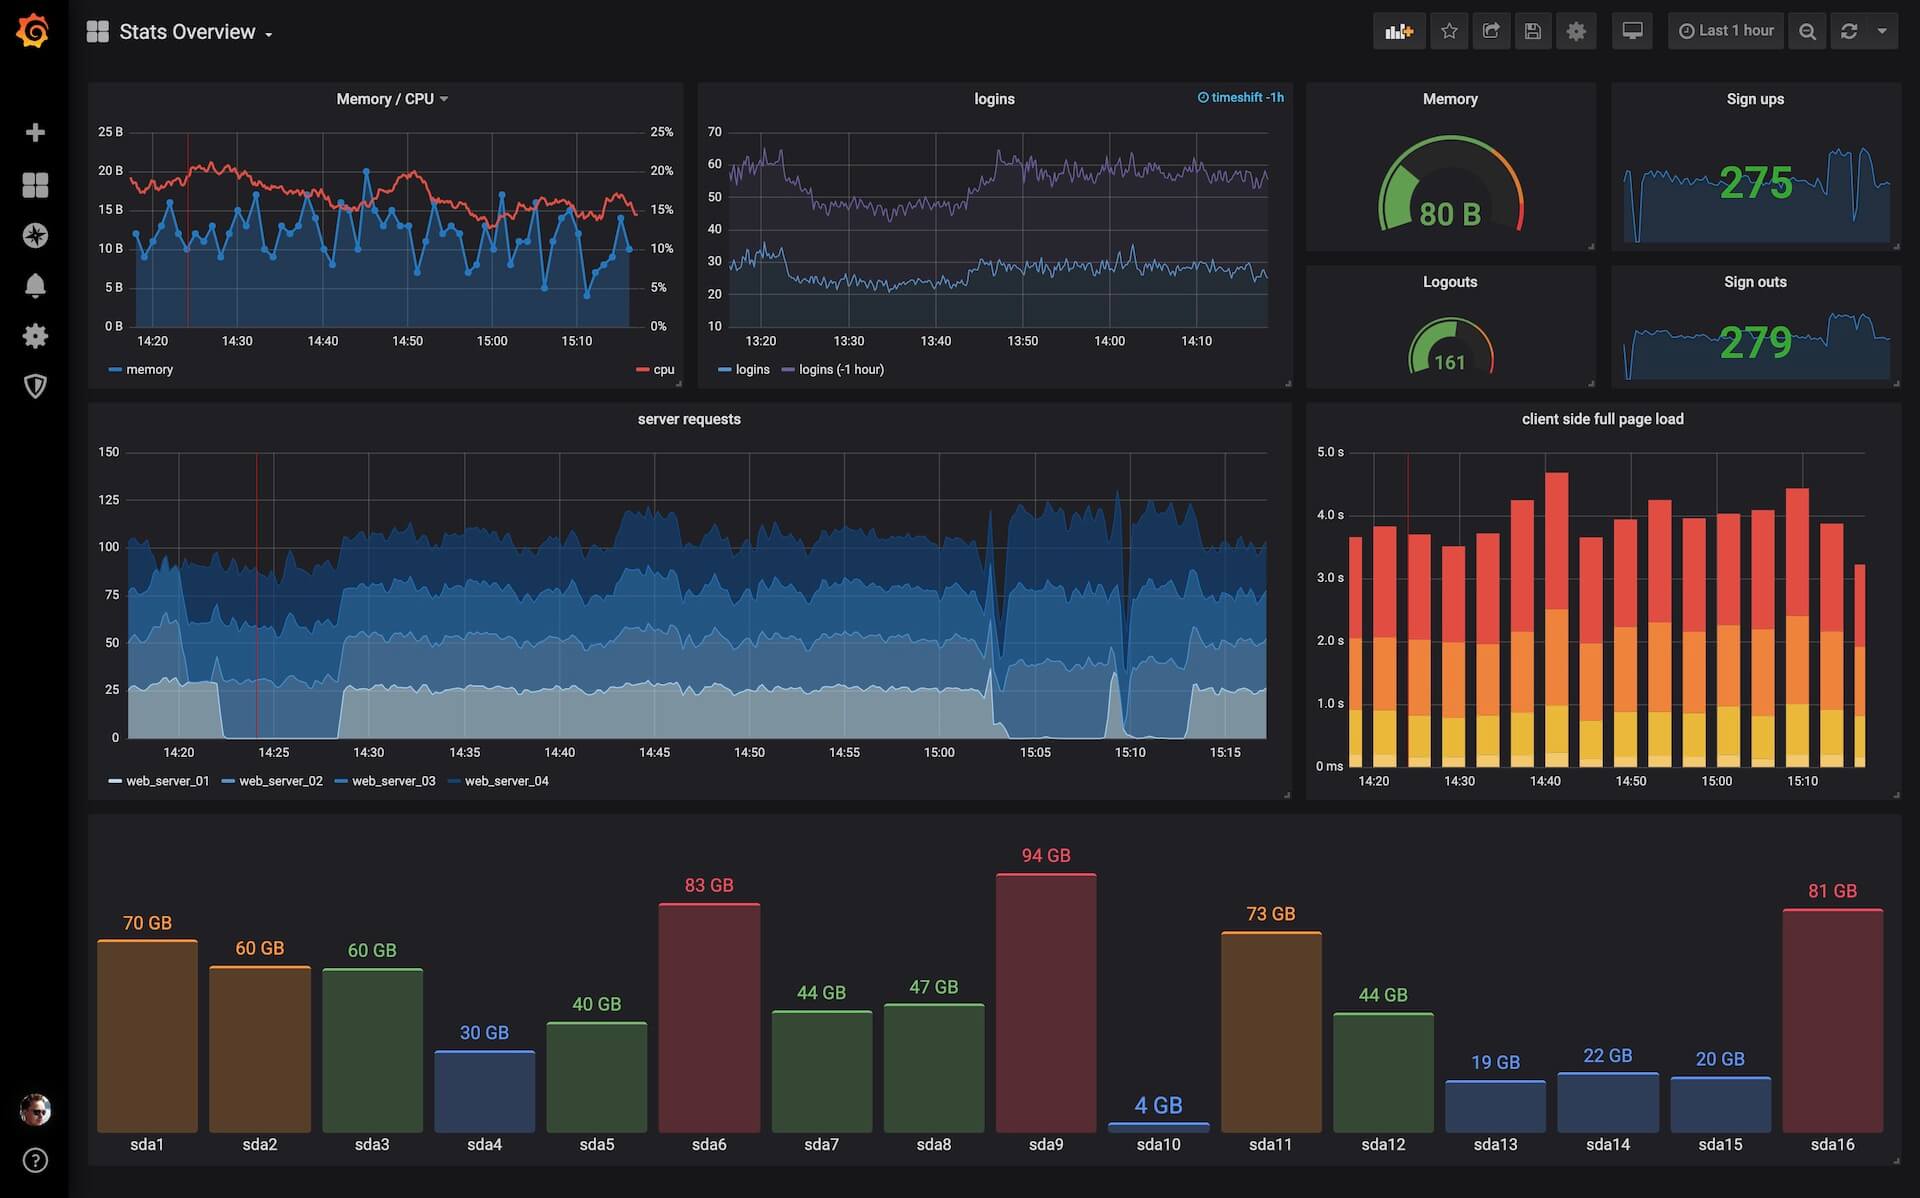
Screenshots
A closer look at Grafana.
Setup time
A few minutes
Deployment
Your own server
Services
1 connected service
Everything you need, running where you choose.
Get the full Grafana experience with Easypanel handling the repetitive infrastructure work around it.
From template to live app in three steps.
Easypanel turns the template into real services, storage, and domains on the server you already control.
Already have Easypanel? Open your dashboard at the URL or IP of your own installation.
Installation guide| Option | Default | Required |
|---|---|---|
App Service Name | grafana | Required |
App Service Image | grafana/grafana-oss:13.0.1 | Required |
Version bumped to 13.0.1
Deploy with confidence.
The template handles the application setup while Easypanel keeps the infrastructure understandable and under your control.